

Getting Started
Click Dashboards in the left sidebar. The list has three tabs: My dashboards, Shared with me, and All.Create a dashboard
Click New dashboard. Chamelio creates an empty dashboard straight away and opens it.- Click the title (New Dashboard) to rename it.
- Click Add description to explain what the dashboard is for.
- Click the star to add it to your favorites.
Add a widget
1
Choose what to measure
Click Create Widget, then choose Contracts or Flows. This sets the data the widget is built from, and the options in the next step.
2
Choose a chart type
Pick Bar, Pie, Number, or Table. You can switch between them at any time - the Preview updates as you go.
3
Set up the data
Fill in the fields for your data source - see Contract widgets and Flow widgets below.
4
Add it
Check the Preview, then click Add widget.
Contract widgets
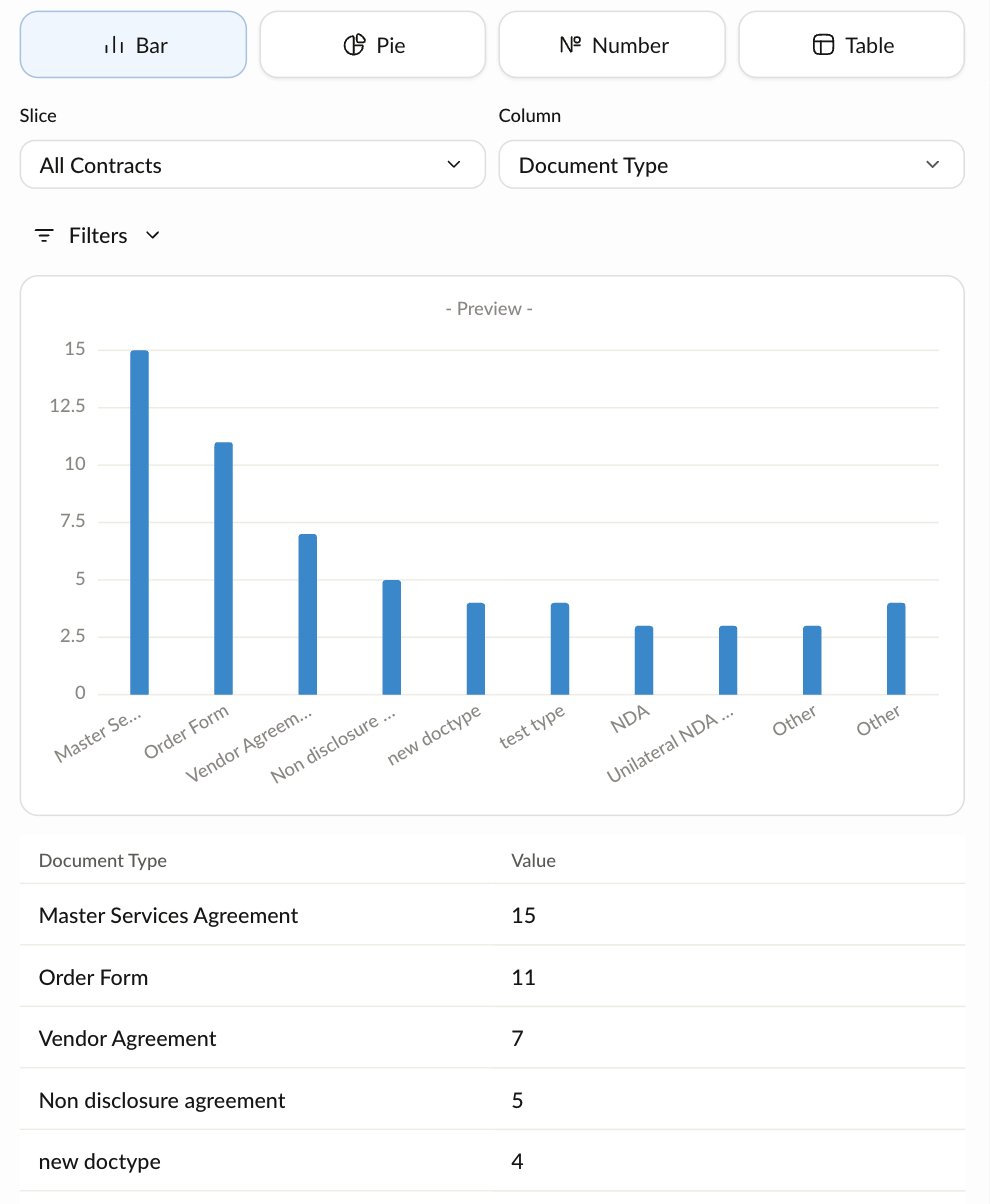
- Slice - which contracts to include: All Contracts, or By Document Type to focus on one type.
- Column - the field to count by, such as Document Type, Active, Uploaded By, or Created At.
- Filters - narrow the contracts by a field, such as End Date, Contract Value, Counter Party Name, Auto Renewal, or Active. Use Add from Attributes for other fields. Each filter shows as a chip - click × on it to remove it, or Clear Filters to remove them all.
Flow widgets
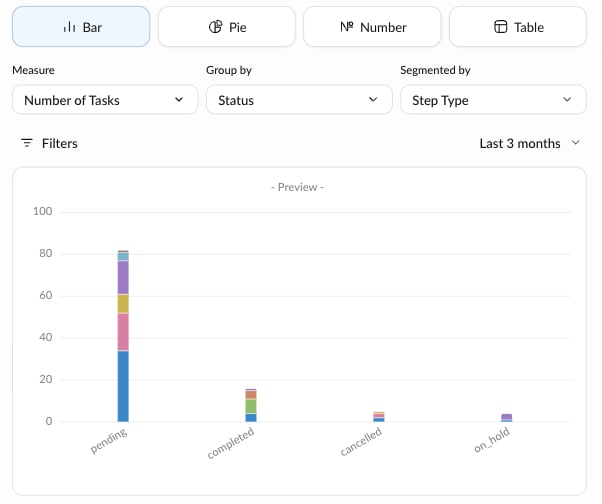
- Measure - what to calculate: Number of Tasks, Avg Time to Completion, Median Time to Completion, Total Time Spent, Completion Rate, Approvals, Rejections, or Negotiation.
- Group by - how to split the results, such as Workflow, Assignee, Owner, Status, Step Type, or Date.
- Segmented by (optional) - split each group again, for example by Step Type, to show stacked bars. Available after you choose a Group by.
- Time range - Last week, Last month, Last 3 months (the default), Last 6 months, Last year, or All time.
- Filters - narrow the tasks, for example by Flow, Assignee, Priority, Status, or Days in Step.
Arrange and manage widgets
- Click Edit layout to rearrange widgets by dragging their handle. Click Finish editing when you’re done.
- Use a widget’s ⋮ menu to Edit widget, Export widget, or Delete widget.
Share a dashboard
New dashboards are private. To share one, open the dashboard’s ⋮ menu, select Share, choose who has access under Dashboard access, and click Save:- Private - only Chamelio admins and the dashboard owner can view and edit it.
- Organization - available to your organization. Members with the Viewer role don’t get access automatically - add them to share it with them.
- Shared - only the people you add can view it, and eligible users can also edit.