> ## Documentation Index
> Fetch the complete documentation index at: https://docs.chamelio.ai/llms.txt
> Use this file to discover all available pages before exploring further.
# Dashboards
> Build dashboards of charts and numbers from your contracts and flows, share them with your team, and pin widgets to your Home page
Dashboards turn your contract and flow data into charts you can check at a glance - for example, how many active contracts you have of each type, or how many tasks are pending in each flow. Each dashboard is made of widgets, and each widget is one chart, number, or table.
## Getting Started
Click **Dashboards** in the left sidebar. The list has three tabs: **My dashboards**, **Shared with me**, and **All**.
## Create a dashboard
Click **New dashboard**. Chamelio creates an empty dashboard straight away and opens it.
* Click the title (**New Dashboard**) to rename it.
* Click **Add description** to explain what the dashboard is for.
* Click the star to add it to your favorites.
## Add a widget
Click **Create Widget**, then choose **Contracts** or **Flows**. This sets the data the widget is built from, and the options in the next step.
Pick **Bar**, **Pie**, **Number**, or **Table**. You can switch between them at any time - the **Preview** updates as you go.
Fill in the fields for your data source - see [Contract widgets](#contract-widgets) and [Flow widgets](#flow-widgets) below.
Check the **Preview**, then click **Add widget**.
New widgets are named **New Widget**. To give it a clear name, open the widget's **⋮** menu, select **Edit widget**, click the name at the top of the panel, type a new one, and click **Save widget**.
### Contract widgets
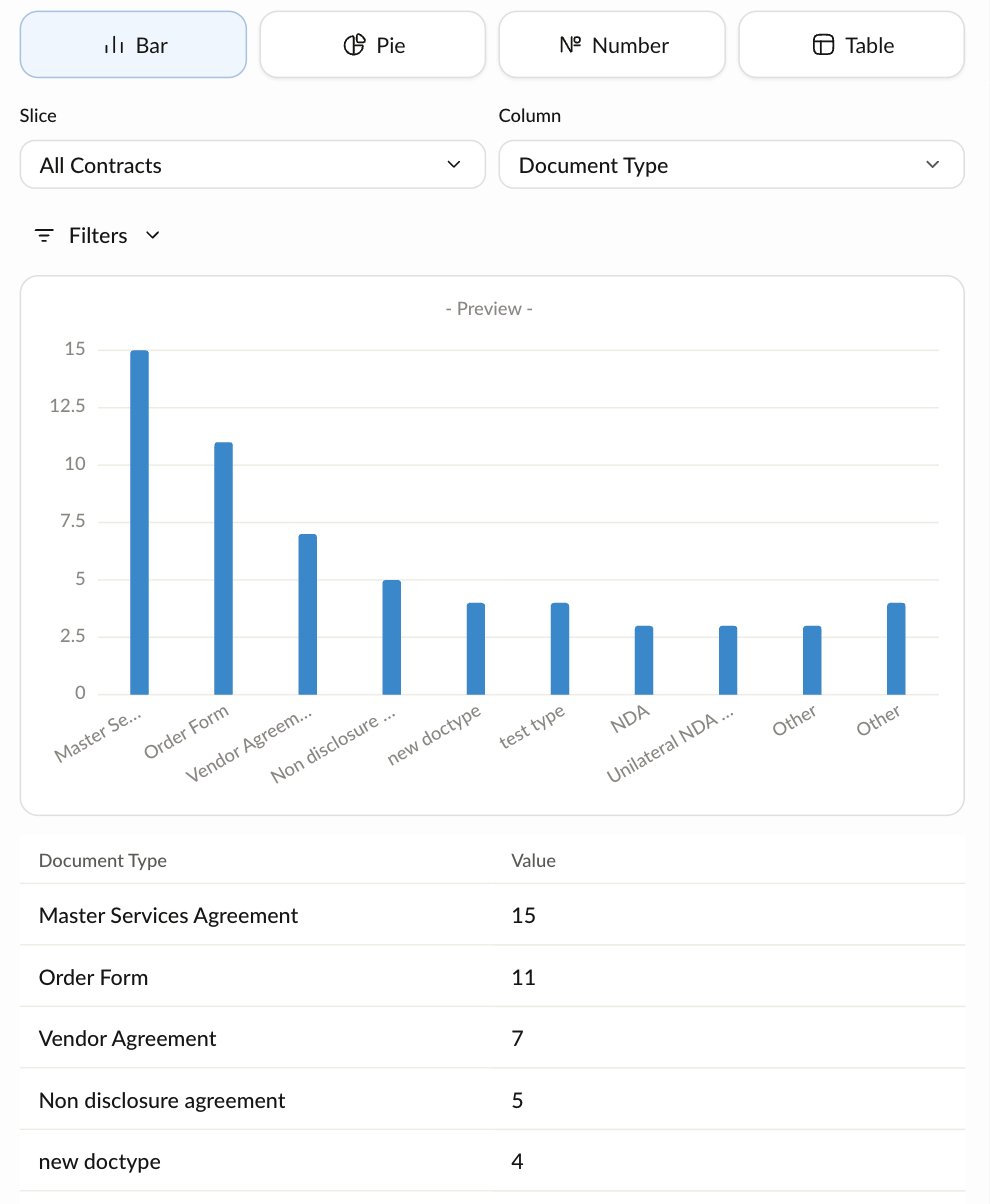 * **Slice** - which contracts to include: **All Contracts**, or **By Document Type** to focus on one type.
* **Column** - the field to count by, such as **Document Type**, **Active**, **Uploaded By**, or **Created At**.
* **Filters** - narrow the contracts by a field, such as **End Date**, **Contract Value**, **Counter Party Name**, **Auto Renewal**, or **Active**. Use **Add from Attributes** for other fields. Each filter shows as a chip - click **×** on it to remove it, or **Clear Filters** to remove them all.
For example, to chart active contracts by type: choose **Bar**, keep **All Contracts**, set **Column** to **Document Type**, and add the filter **Active** = **Active**.
### Flow widgets
* **Slice** - which contracts to include: **All Contracts**, or **By Document Type** to focus on one type.
* **Column** - the field to count by, such as **Document Type**, **Active**, **Uploaded By**, or **Created At**.
* **Filters** - narrow the contracts by a field, such as **End Date**, **Contract Value**, **Counter Party Name**, **Auto Renewal**, or **Active**. Use **Add from Attributes** for other fields. Each filter shows as a chip - click **×** on it to remove it, or **Clear Filters** to remove them all.
For example, to chart active contracts by type: choose **Bar**, keep **All Contracts**, set **Column** to **Document Type**, and add the filter **Active** = **Active**.
### Flow widgets
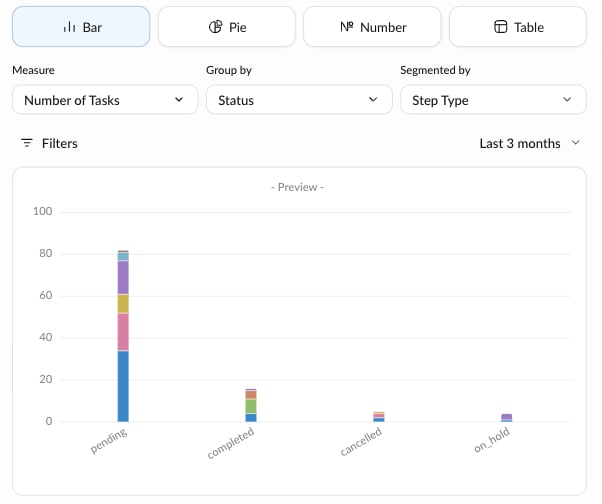 * **Measure** - what to calculate: **Number of Tasks**, **Avg Time to Completion**, **Median Time to Completion**, **Total Time Spent**, **Completion Rate**, **Approvals**, **Rejections**, or **Negotiation**.
* **Group by** - how to split the results, such as **Workflow**, **Assignee**, **Owner**, **Status**, **Step Type**, or **Date**.
* **Segmented by** (optional) - split each group again, for example by **Step Type**, to show stacked bars. Available after you choose a **Group by**.
* **Time range** - **Last week**, **Last month**, **Last 3 months** (the default), **Last 6 months**, **Last year**, or **All time**.
* **Filters** - narrow the tasks, for example by **Flow**, **Assignee**, **Priority**, **Status**, or **Days in Step**.
For example, to see where tasks are stuck: choose **Bar**, set **Measure** to **Number of Tasks**, and **Group by** to **Status**.
## Arrange and manage widgets
* Click **Edit layout** to rearrange widgets by dragging their handle. Click **Finish editing** when you're done.
* Use a widget's **⋮** menu to **Edit widget**, **Export widget**, or **Delete widget**.
## Share a dashboard
New dashboards are private. To share one, open the dashboard's **⋮** menu, select **Share**, choose who has access under **Dashboard access**, and click **Save**:
* **Private** - only Chamelio admins and the dashboard owner can view and edit it.
* **Organization** - available to your organization. Members with the Viewer role don't get access automatically - add them to share it with them.
* **Shared** - only the people you add can view it, and eligible users can also edit.
The same **⋮** menu has **Add to favorites**, **Export dashboard**, and **Delete Dashboard**.
## Show a widget on your Home page
Your Home page shows widgets too. To show a widget from one of your dashboards there, open the Home widget's **⋮** menu, select **Add from dashboard**, choose a dashboard, then choose the widget.
* **Measure** - what to calculate: **Number of Tasks**, **Avg Time to Completion**, **Median Time to Completion**, **Total Time Spent**, **Completion Rate**, **Approvals**, **Rejections**, or **Negotiation**.
* **Group by** - how to split the results, such as **Workflow**, **Assignee**, **Owner**, **Status**, **Step Type**, or **Date**.
* **Segmented by** (optional) - split each group again, for example by **Step Type**, to show stacked bars. Available after you choose a **Group by**.
* **Time range** - **Last week**, **Last month**, **Last 3 months** (the default), **Last 6 months**, **Last year**, or **All time**.
* **Filters** - narrow the tasks, for example by **Flow**, **Assignee**, **Priority**, **Status**, or **Days in Step**.
For example, to see where tasks are stuck: choose **Bar**, set **Measure** to **Number of Tasks**, and **Group by** to **Status**.
## Arrange and manage widgets
* Click **Edit layout** to rearrange widgets by dragging their handle. Click **Finish editing** when you're done.
* Use a widget's **⋮** menu to **Edit widget**, **Export widget**, or **Delete widget**.
## Share a dashboard
New dashboards are private. To share one, open the dashboard's **⋮** menu, select **Share**, choose who has access under **Dashboard access**, and click **Save**:
* **Private** - only Chamelio admins and the dashboard owner can view and edit it.
* **Organization** - available to your organization. Members with the Viewer role don't get access automatically - add them to share it with them.
* **Shared** - only the people you add can view it, and eligible users can also edit.
The same **⋮** menu has **Add to favorites**, **Export dashboard**, and **Delete Dashboard**.
## Show a widget on your Home page
Your Home page shows widgets too. To show a widget from one of your dashboards there, open the Home widget's **⋮** menu, select **Add from dashboard**, choose a dashboard, then choose the widget.